
Measure guest satisfaction.
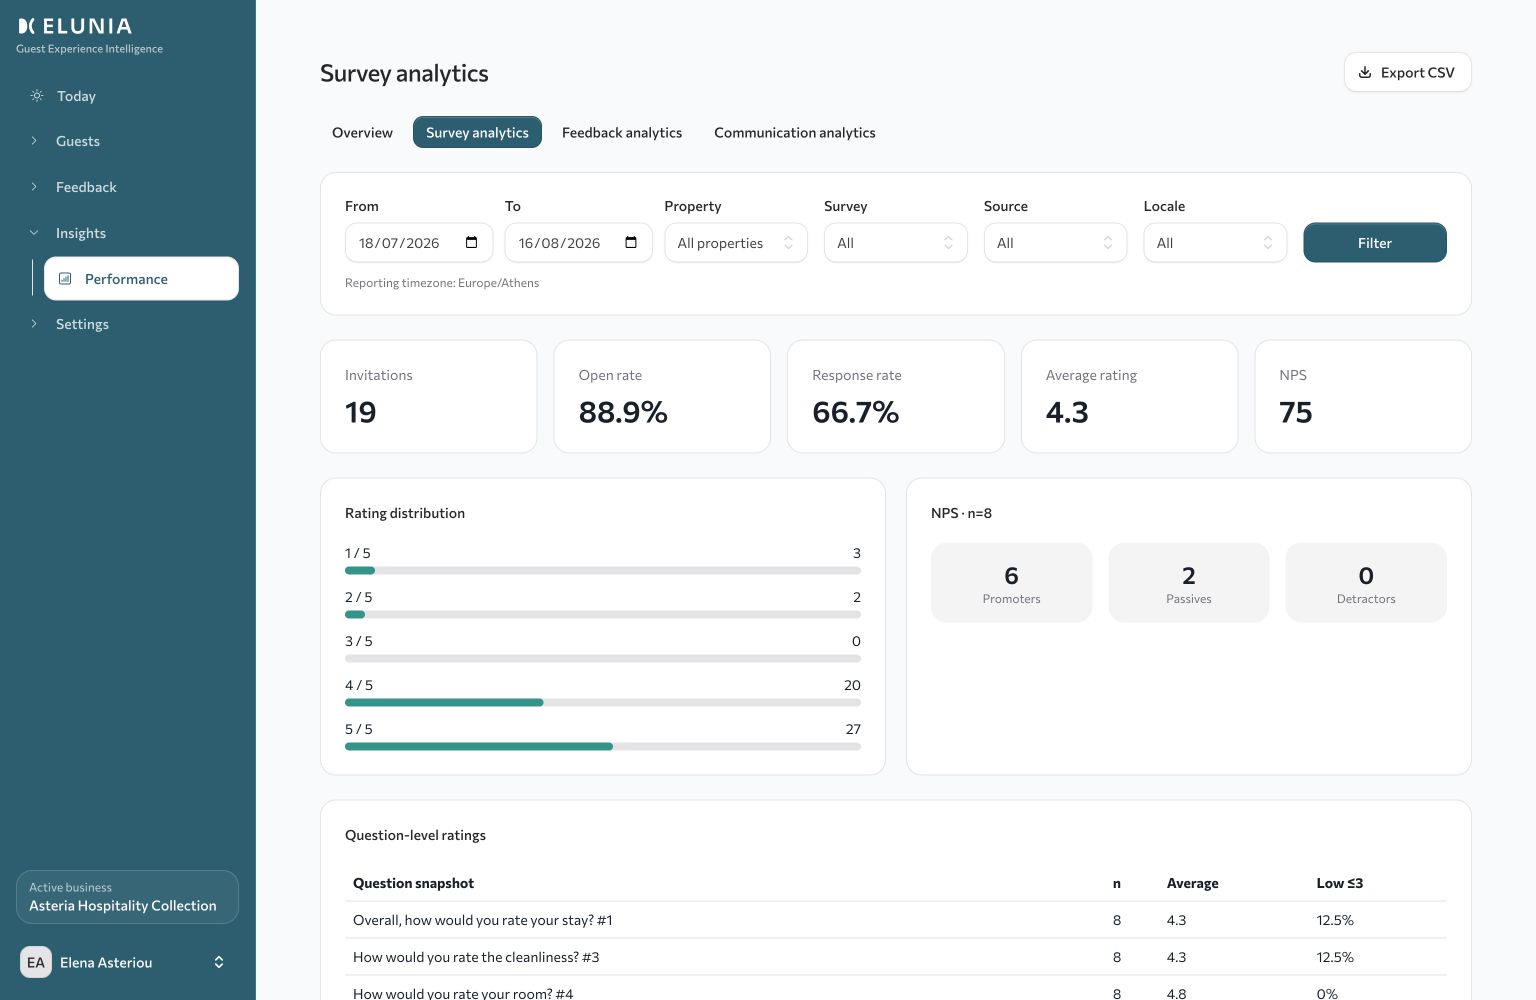
Track ratings, NPS, response activity and sample sizes.
Management reports
Connect satisfaction, response activity, operational cases, recovery and communication performance without a generic BI project.
Start free trial21-day Professional trial - No credit card required
Track ratings, NPS, response activity and sample sizes.
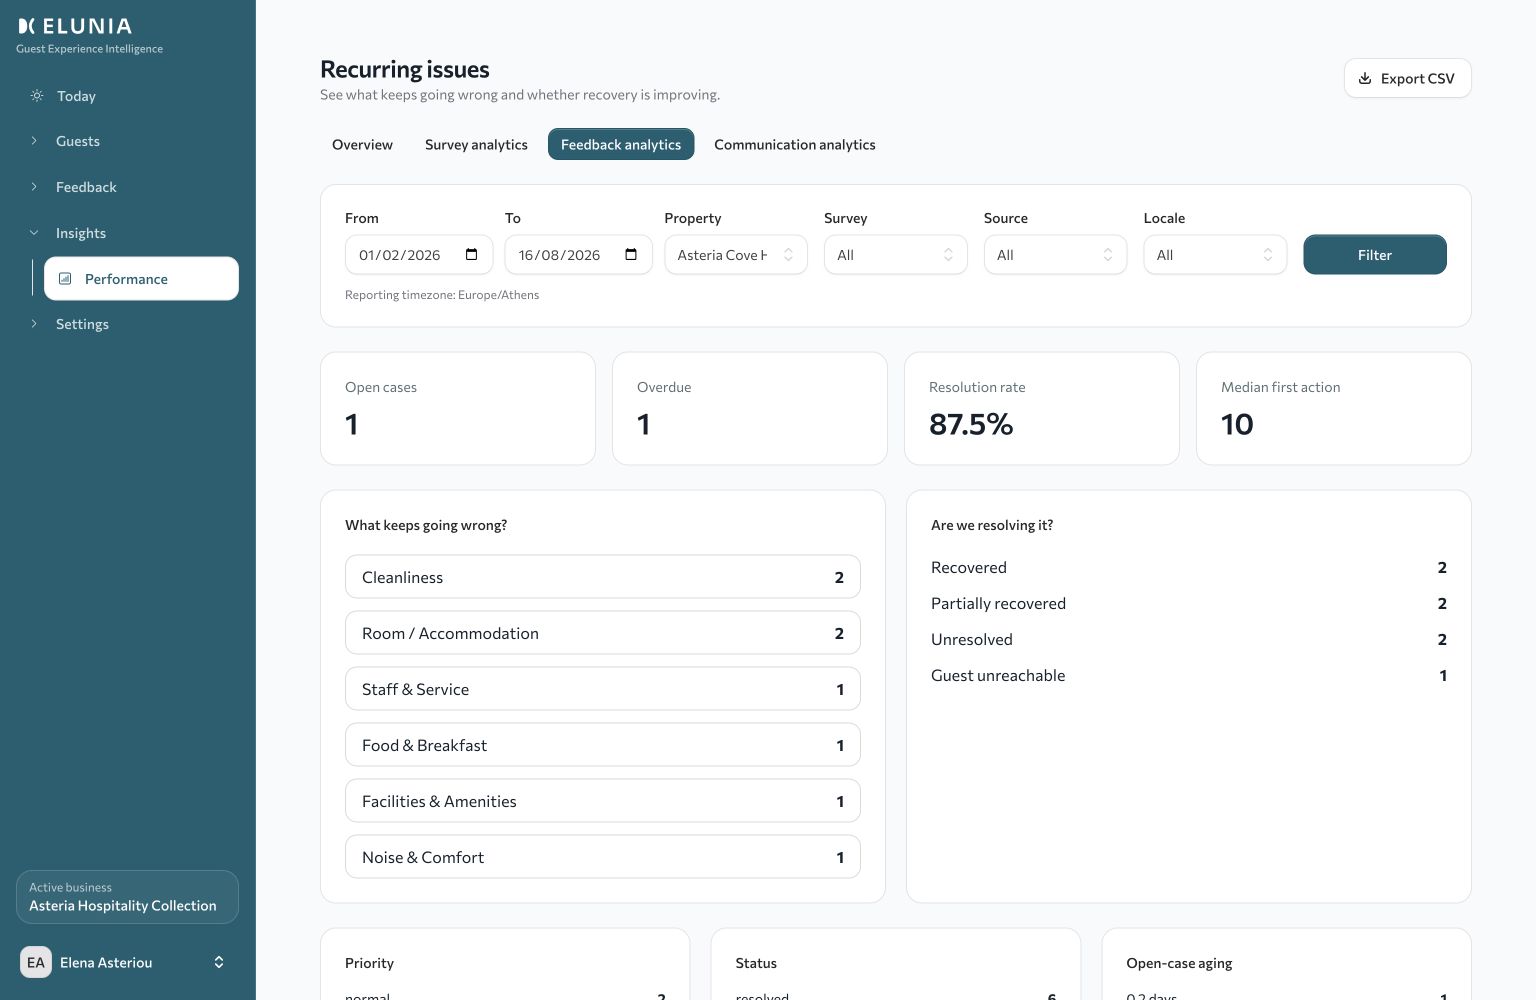
Follow recurring categories, open issues, resolution and recovery outcomes.
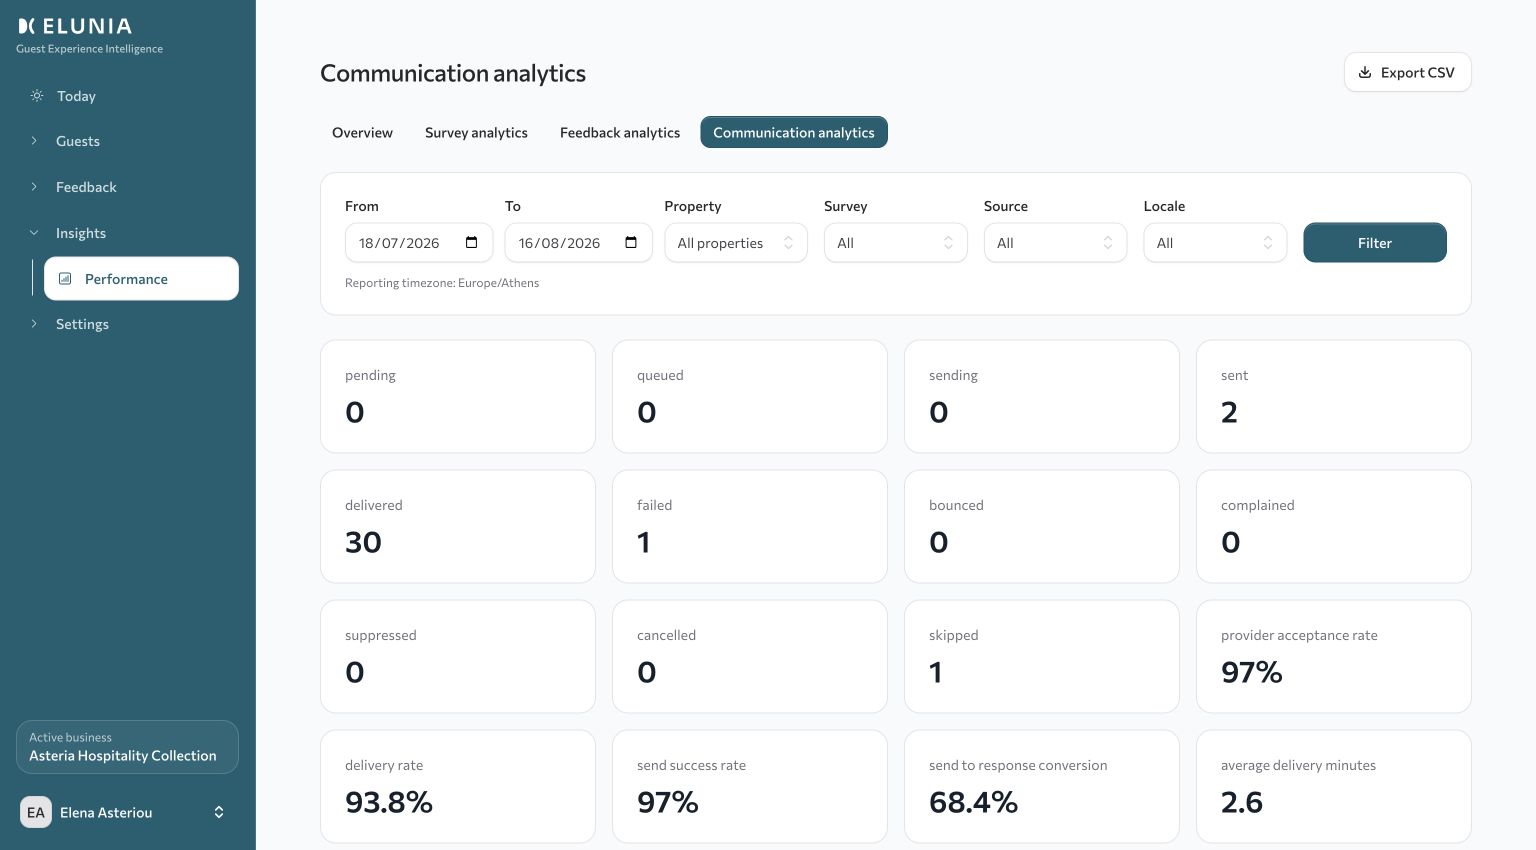
See accepted, delivered, failed and suppressed communication activity.
The daily dashboard keeps immediate attention visible.
 Operational overview
Operational overview
Guest signal
Needs attention
Owner action
Recorded outcome
Property-level evidence
Layout preview only. No live guest data or performance metrics.
Existing daily and weekly digests keep teams informed. Professional and Business can export supported analytics as CSV; there are no PDF archives.
Start a 21-day trial of Professional. No credit card required
Professional trial · No credit card required
